The yield curve is a curve that plots the relationship between the yields (interest rates) plotted on the y-axis and the time to maturity on the x-axis. Typically the yield curve is an upward sloping curve, meaning that the yield for the longer term to maturity is higher than the yields for the shorter term to maturity.
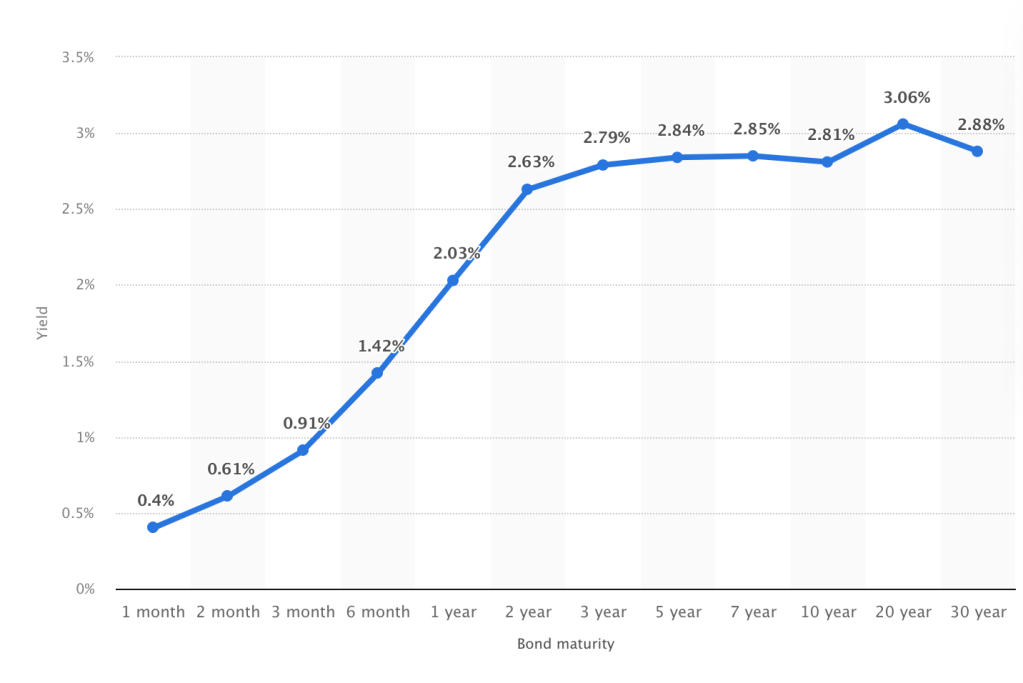
The flattening of the yield curve is a phenomenon where the yield doesn’t change much across the maturities. Whereas when the short maturity yield overshoots the longer maturity yield then we end up with an inverted yield curve. We have observed that the slope of the yield curve i.e. the difference between the long term and short term rates has turned negative before any recession thereby acting as one of the prominent indicators.

is the yield curve flattening now?

The above graph shows that the yield curve had inverted in April 2022 and it’s somewhat flattened as we speak. This is an indication of recession right? Well, we are at a crossroads because of the spread curve i.e. the difference between the short-term rate and the long-term rate is still positive, thereby giving us mixed signals.
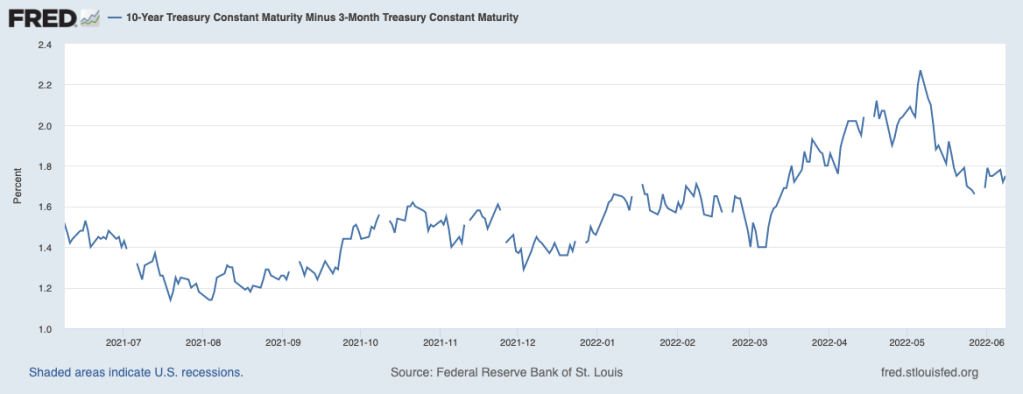
One reason can be that the Fed has been buying back bonds over the last 2 years horizon and it might have led to an undervalued 10 years yield which will revert back to the original levels when the central bank offsets its balance sheet.
We have to remember one thing that banks finance long-term borrowings with short-term financing. The difference in the spread between the two is the income of the bank. As the short-term rates overshoot the long-term rates, the banks will be reluctant to lend thereby leading to a slowdown in the economy.
The interesting question is, how can we use the yield curve as a lead indicator instead of a lag indicator to predict the next recession. For starters establishing the connection between movement in the yield curve and the recession can be tricky. There isn’t a single factor that can pinpoint the connection. However, there are broadly two things that influence the curve. One of them is the monetary policy and the other is the expectation of the market.
How does monetary policy affect the yield curve? Well, one of the common responses to inflationary conditions is to increase the short-term rate. This is aimed at reducing the liquidity in the market thereby curbing expenditure and reducing inflation. However, it is expected that in the long run, the rates will revert to the original levels. hence, the short-term rates rise at a faster rate whereas the long-term rates rise at a lower yield causing an inversion.
The increase in the short term rates singles a slowdown in the economy and the market expectation forces the long term rates to go down further thereby flattening the curve than leading to an inversion.
Arturo Estrella and Mary R. Trubin tried to come up with a predictive model as shown below
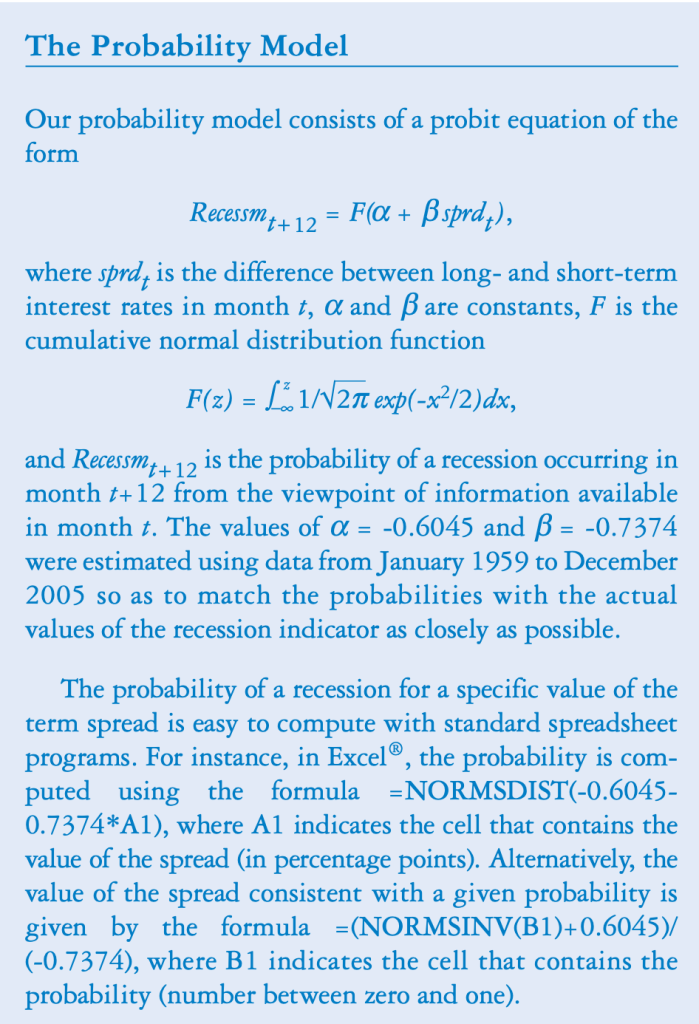
They calibrated the parameters by backtesting to match the actual probabilities of historical recessions. Details of their work can be found here. Given the complexities involved and the intertwined nature of the financial markets, can we really predict recession based on a single factor?
